The electric vehicle (EV) revolution is not just changing cars; it is redefining the entire energy and transportation landscape. How to invest in EV charging stations has quickly become the most pressing question for property owners, entrepreneurs, and energy companies worldwide. This is not just about adopting a green trend. It is about seizing a massive, lucrative commercial investment opportunity. According to the International Energy Agency (IEA), the global electric car stock is projected to surpass 70 million units by 2025 and is on track to reach 145 million by 2030. This unprecedented growth trajectory drives an urgent, exponential demand for reliable EV charging infrastructure. This demand cuts across every sector, from corporate fleets needing high-capacity Level 3 chargers to residential complexes requiring smart Level 2 units.
To succeed in this fast-moving sector, you need more than just hardware. You need a robust business plan. This authoritative guide provides a clear, step-by-step framework for commercial success. We will detail the core EV charging business models, analyze the essential ROI formulas, and break down the capital expenditure (CapEx) and operational expenditure (OpEx). Our goal is to transform your investment from a simple installation into a powerful, scalable revenue stream. We cover crucial topics like strategic site selection, navigating complex government incentives, and leveraging software to minimize long-term operational costs. Following this guide ensures your charging venture is built on a foundation of sound financial modeling and future-proof technology.
The need for robust charging infrastructure is driven by aggressive global electrification targets. Governments and major corporations are committing to zero-emission goals, creating guaranteed market growth for the next two decades.
Policy Mandates: Countries are setting fixed deadlines (e.g., 2035) for phasing out internal combustion engine (ICE) vehicle sales, accelerating EV adoption rates.
Declining Battery Costs: Lower battery prices make EVs more affordable, further increasing vehicle sales and subsequent charging demand.
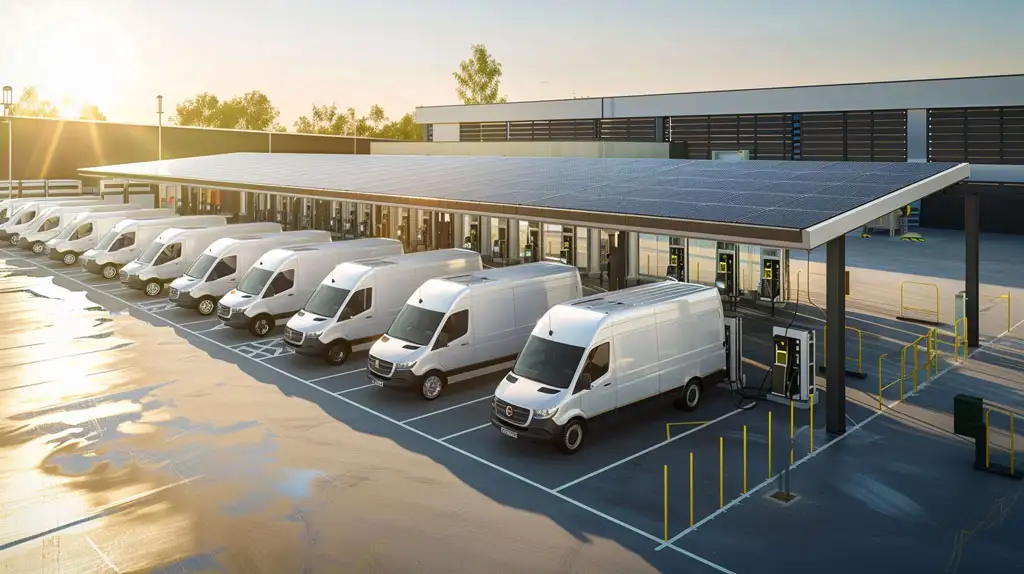
Corporate Fleet Electrification: Logistics and delivery companies are under pressure to electrify fleets, requiring massive, centralized charging hubs.
Region | Primary Investment Focus | Key Regulatory Driver | Current Market Trend |
|---|---|---|---|
USA | Public DC Fast Charging along highway corridors, workplace, and fleet depots. | Inflation Reduction Act (IRA) and state-level mandates (e.g., California’s ZEV rules). | Rapid expansion, high utilization of DCFC, heavy focus on public funding. |
Europe (EU) | Public Level 2 (urban/destination) and cross-border DCFC networks. | EU Green Deal, requiring charging every 60 km on major transport networks. | High density of public charging; strong integration with local utility Smart Grids. |
Asia-Pacific (APAC) | Residential and urban charging (driven by China’s massive market), battery swapping models. | National energy policy (e.g., China’s national standards) and clean air acts. | Focus on high-speed deployment and integration with two-wheeler EVs. |
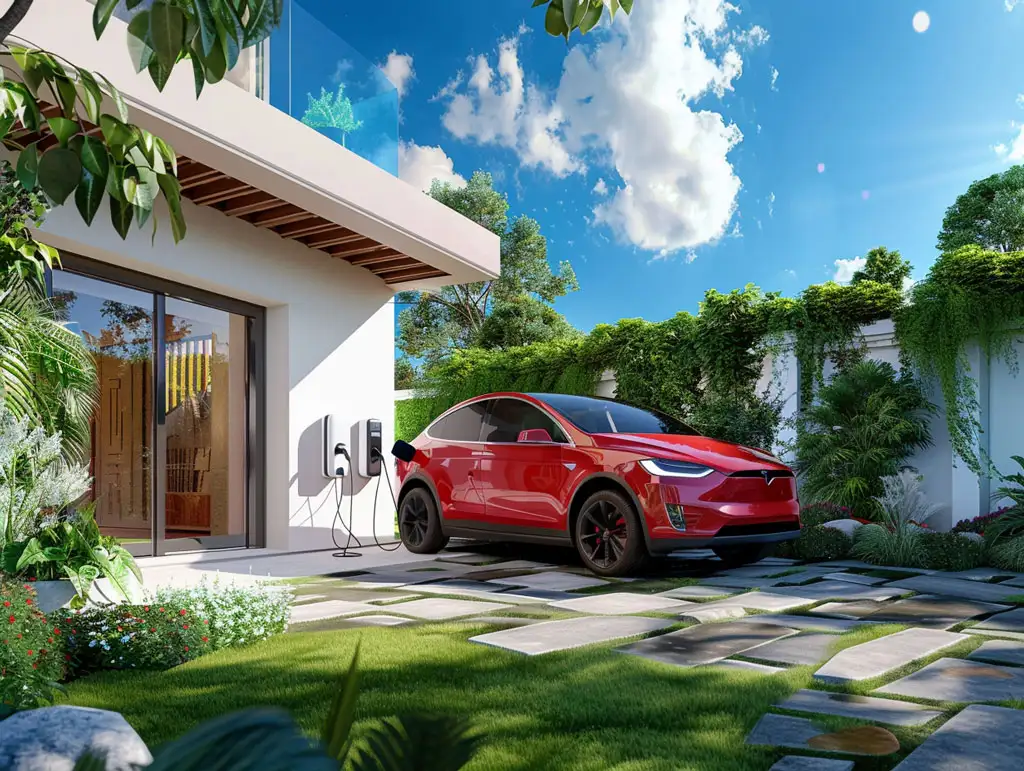
Successful investment starts with matching the charger type to the location’s Dwell Time (how long a vehicle stays parked) and power needs.
Location: Shopping centers, restaurants, hospitals, fitness centers, and entertainment venues.
Dwell Time: Medium (30 minutes to 4 hours).
Charger Type: Level 2 (AC) is ideal, providing valuable range while customers use the facility. DC Fast Charging (DCFC) should be considered for high-turnover anchor locations.
Primary Revenue: Indirect revenue (increased customer spend) is often more valuable than direct charging fees.
Location: Logistics centers, transit authorities, corporate campuses.
Dwell Time: Long (overnight or during work shifts).
Charger Type: Primarily networked Level 2 for overnight charging, supplemented by high-power DCFC for rapid mid-day top-ups or route changes.
Primary Revenue: Operational savings (fuel and maintenance cost reduction) and guaranteed uptime.
Location: Apartment complexes, condos, townhouses.
Dwell Time: Very Long (6 to 12 hours).
Charger Type: Networked Level 2 chargers are essential. Must incorporate Dynamic Load Balancing (DLB) software to safely distribute power across multiple vehicles without costly electrical upgrades.
Primary Revenue: Subscription or pay-per-use model for residents, adding significant property value.

Choosing the right financial model dictates profitability. Investors must look beyond simple energy sales.
These models involve charging the end-user for access or energy. A robust Charging Station Management System (CSMS) is required for all models.
Revenue Model | Pricing Structure | Ideal Use Case | Pros for Investors |
|---|---|---|---|
Pay-Per-kWh | Based on energy consumed (e.g., $0.40/kWh). | High-traffic public stations, DCFC. | Fair to users, scales with energy price increases, most common. |
Per-Minute | Based on time connected (e.g., $0.50/minute). | DCFC where rapid turnover is critical. | Discourages idling (occupying space after charging is complete); maximizes utilization. |
Subscription / Membership | Fixed monthly fee for unlimited or discounted charging. | Residential MUDs, workplace, loyalty programs. | Predictable, recurring revenue stream; fosters customer loyalty. |
Hybrid | Combination (e.g., $0.30/kWh + $5 session fee). | Urban charging hubs. | Balances transparency with operational cost coverage. |
This is where smart investors generate their highest ROI, monetizing the driver’s dwell time.
Increased Sales/Retail Uplift: EV drivers, known to be high-income, spend time at the host business. A mall or grocery store can see a direct increase in sales that justifies the infrastructure cost.
Property Value Enhancement: Installing charging stations can increase the appraisal value of a commercial property by up to 8%, according to a study by the Urban Land Institute (ULI). This acts as a key amenity for attracting high-value tenants and ensuring retention.
Advertising Revenue: Utilizing media screens on modern chargers to sell targeted advertising space to local businesses or national brands.

To transform a charging station from a cost center into a marketing and revenue engine, investors must leverage software and digital assets.
Targeted Promotions: Use Charger Media Screens or connected apps to push real-time promotions (e.g., “15% off coffee while you charge”).
Enhanced Customer Journey: Integrate the charging session into the host business’s app (e.g., check charging status while shopping) to keep the customer engaged on-site longer.
Integrated Loyalty Programs: Offer discounted charging rates or free charging hours as a loyalty perk tied to the host business’s existing program.
Data Collection: Smart chargers collect valuable data on customer behavior and preferences, which can be used to refine marketing strategies for the host business.
| Cost Component | Description | Estimated Range (Per Unit) | Key Variable |
|---|---|---|---|
| Hardware | Charger unit price (Level 2 or DCFC). | $2,000 – $70,000 | Power output (kW) and features (media screens, dual ports). |
| Installation/Labor | Electrician fees, trenching, wiring, concrete work. | $3,000 – $50,000 | Distance from main electrical panel, need for extensive groundwork. |
| Electrical Upgrades | New transformer, panel upgrade, utility service increase. | $5,000 – $200,000+ | Site’s existing capacity vs. required DCFC power draw. |
| Permits & Fees | Local permits, inspection, utility connection fees. | $500 – $3,000 | Local jurisdiction and complexity of the project. |
Annual ROI =
Annual Net Profit
Net Initial Investment
× 100%
Investing in charging goes beyond direct revenue; it generates valuable non-financial returns.
Environmental Leadership: Signals a strong commitment to ESG (Environmental, Social, and Governance) goals, attracting environmentally conscious customers and investors.
Future-Ready Image: Positions the business as innovative and adaptive to the changing technology landscape, enhancing brand perception.
Talent Attraction/Retention: Offering workplace charging is increasingly a required benefit for high-skilled employees, aiding in recruitment.
Customer Preference: Studies show customers will choose a destination with charging over a competitor without it, especially during long-haul travel.

Long-term investment success requires planning for the next generation of EV technology.
NACS Dominance: The rapid adoption of the North American Charging Standard (NACS) by major automakers (Ford, GM, Rivian) means investors must prioritize NACS-compatible chargers or those with seamless adapter options.
CCS Longevity: While NACS is growing, CCS remains the current standard for most non-Tesla vehicles and will require support for years. Future-proofing means choosing chargers designed for connector flexibility.
Reserved Capacity: Always install initial wiring and electrical service with 20% to 30% extra capacity to accommodate future charger additions without expensive grid re-trenching.
Modular Hardware: Select chargers that allow for power sharing or capacity upgrades by simply adding power modules rather than replacing the entire unit.
V2G (Vehicle-to-Grid): Two-way charging allows the EV to sell energy back to the grid. This will be a major revenue stream in the future for fleet and parking assets.
Wireless Charging: Offers a hassle-free, autonomous experience, making it ideal for future integration with robotic parking and autonomous driving services.
The average payback period for a commercial EV charging station typically ranges from 3 to 7 years, heavily dependent on two factors: utilization rate and the incentives received. Sites with high daily utilization (40% or more) and substantial government subsidies (reducing CapEx by over 50%) can achieve payback in under 3 years. Without high utilization or subsidies, the payback period can be much longer.
The single biggest hidden cost is the Demand Charge levied by utility companies, particularly for DC Fast Charging. This fee is based on the highest single peak power (kW) drawn during the month, not just the total energy consumed (kWh). To mitigate this, investors must utilize smart load management software or Battery Energy Storage Systems (BESS) to shave peak demand and reduce the fee.
The choice should be based on the customer’s expected Dwell Time:
Level 2 (AC): Ideal for long-dwell locations (4+ hours), such as residential buildings, workplaces, and hotels. Focuses on convenience and lower OpEx.
DC Fast Charging (DC): Essential for short-dwell locations (20-60 minutes), such as highway rest stops, convenience stores, and high-turnover public hubs. Focuses on speed and high potential revenue, despite high CapEx.
Yes, the “Free Charging” model can be a highly effective indirect revenue strategy. By offering charging for free (often subsidized by advertising or the host business), a site can dramatically increase foot traffic and customer dwell time. The profit is made through increased retail sales, higher property occupancy rates, or premium fees collected from advertising on the charger’s media screen, rather than the electricity sale itself.
The most critical features of a Charging Station Management System (CSMS) for commercial ROI are:
Dynamic Load Balancing (DLB): Safely manages and distributes power among multiple chargers within a fixed electrical capacity.
Time-of-Use (TOU) Pricing: Allows the operator to set different tariffs based on time of day to maximize profit and avoid peak utility charges.
Remote Diagnostics and Monitoring: Ensures high charger uptime (reliability) by allowing remote issue detection and resolution, minimizing maintenance costs.
How to invest in EV charging stations is a question best answered with a strategy that balances immediate costs with future profitability. The true return on investment in EV charging infrastructure is not found solely in the kilowatt-hours sold, but in the intelligent management of the entire ecosystem.
Successful ventures prioritize:
Strategic Site Selection (matching charger to dwell time).
Software-First Approach (using CSMS for ROI tracking and demand charge mitigation).
Aggressive Incentive Capture (reducing net CapEx by 30% to 70%).
To transform your charging infrastructure from an expense into a reliable revenue stream, you need to partner with providers who offer robust, OCPP-compliant hardware and sophisticated software that supports dynamic pricing, load balancing, and V2G readiness. By aligning with a partner focused on maximizing your ROI and minimizing long-term OpEx, you can secure your position in the electric future.
Authority Reference Links
We will send detailed technical info and quotation to you!