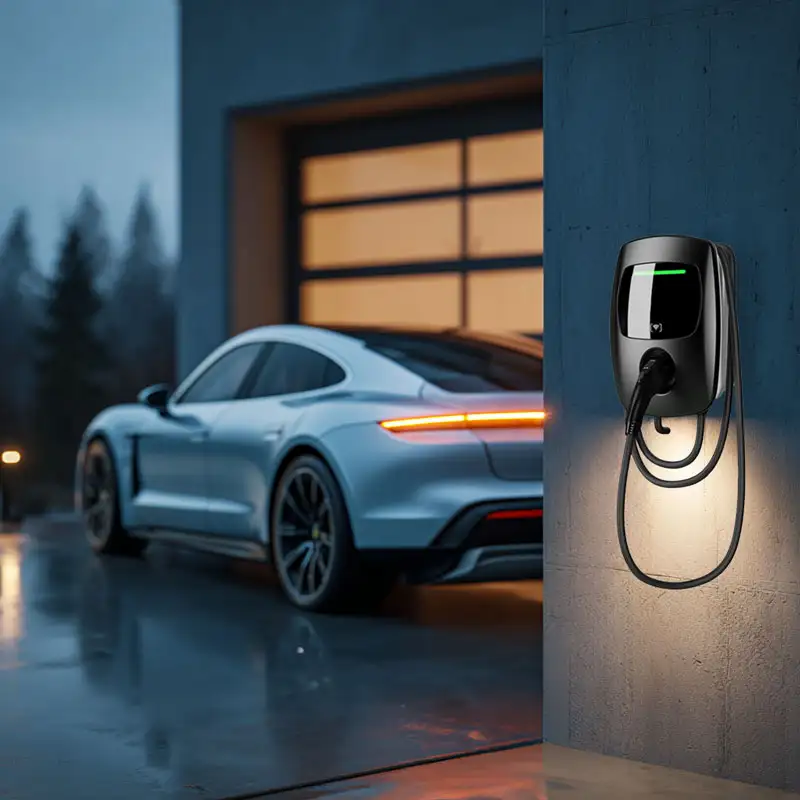
AC — Level 1
- Time to 80% (60 kWh): 40–50 hours
- Typical Use Case: Overnight / residential
Electric vehicle adoption in North America is accelerating, driving a parallel boom in charging infrastructure. The U.S. public charging network grew by ~20% in 2024 (reaching ~200,000 points), and analysts project tens of millions of chargers by 2030 (e.g. PwC forecasts ~35 million U.S. chargers by 2030). Manufacturers (GM, Ford, Tesla, etc.) and charging providers (ChargePoint, Blink, Electrify America, etc.) are investing heavily in network expansion, interoperability upgrades, and software platforms. This rapid evolution has strategic implications for CPOs, fleets, and planners:
Electrification Targets: U.S. and Canadian governments aim for 50–100% of new LDV sales to be electric by 2030–2035. Fulfilling these goals requires strategic charging deployment in urban and rural areas, prioritizing “charging deserts” (underserved communities).
EV Segments: Light-duty vehicles dominate charging demand today, but medium/heavy trucks, buses, and off-road vehicles are emerging. Fleets (delivery, transit, school buses) will increasingly require dedicated charging hubs and depot infrastructure.
Business Models: Charging services range from free/hospitality-funded to pay-per-use networks. Sophisticated CPOs integrate charging-as-service, demand-response programs, and data analytics to optimize ROI. Funding from public–private partnerships (NEVI, state grants, utilities) is a major driver of site viability.
Key Stats: By 2030 the U.S. may have 30–42 million PEVs on the road, driving need for hundreds of thousands of fast chargersdocs.nrel.gov. Canada’s targets envision ~12 million ZEVs by 2035, necessitating ~680,000 public chargers by 2040.
Takeaway: Investors and planners should align charging rollout with vehicle adoption forecasts and policy incentives. Proactively plan for 5–10× growth in charger counts and engage with government programs (e.g. NEVI/ZEVIP) early. Regularly revisit demand assumptions as EV penetration accelerates.
EV Charging Infrastructure are categorized by power and speed:
Level 1 (120 VAC): ~1–2 kW (trickle charging). Rarely used publicly (mainly for home/work fleet overnight).
Level 2 (208–240 VAC, AC): 3–19 kW per port, typically charging ~20–40 miles of range per hour. Common at workplaces, multi-unit dwellings, retail parking. Good for 4–10 h to replenish a BEV overnight.
DC Fast Charge (DCFC): Rapid chargers converting AC to DC onboard vehicle. Key tiers: 50 kW (early fast), 150 kW, 350 kW+ (ultra-fast). Newer chargers (>800 V) can deliver 400 kW+ for premium models, enabling ~250 miles in 20–30 minutes. Commercial corridors will require many 150–350 kW+ units.
A standardized overview:
| Charger Level / Type | Power (kW) | Typical Use & Charging Time | Example Cost (hardware) |
|---|---|---|---|
| Level 2 (AC) | ~7–19 kW | Workplace or home (~6–10 h full charge) | $500–$6,500 |
| DCFC – 50–60 kW | ~50–60 kW | Neighborhood shops (~1–2 h) | $30k–$50k |
| DCFC – 150–180 kW | ~150–180 kW | Urban hubs, public stations (~20–30 min) | $50k–$80k |
| DCFC – 350 kW+ (800V) | 300–500+ kW | Highway travel centers (~10–20 min) | $150k–$250k |
(See “charging speed comparison” chart below for time estimates.)
Table: Charging Speeds & Use Cases (Place chart here)
| Charging Type | Time to 80% (60 kWh) | Typical Use Case |
|---|---|---|
| AC — Level 1 | 40–50 hours | Overnight / residential |
| AC — Level 2 | 4–10 hours | Home, workplace |
| DC fast | 20–60 minutes | Road trips / quick top-ups |
Key Insights:
Hardware & Site Costs: EVSE hardware costs are trending down (e.g. Level 2 ports ~$400–$6,500; DCFC ~$10k–$40k), but installation varies widely (from a few thousand to hundreds of thousands for complex DCFC sites). Site preparatory work (transformer, trenching, permits) often dominates costs.
Utilization Matters: Business viability hinges on utilization. Highway DCFC often sees low daily traffic; success requires multiple pulls (fleet stops, retail synergy) or auxiliary revenue. Urban Level-2 sees steadier use (commuters, apartments).
Connector Standards: North America historically used SAE J1772 (AC) and CCS1 (DC). Tesla’s NACS is now rapidly being adopted by major OEMs. By 2025, most new U.S./Canadian EVs will support NACS (Ford, GM, BMW, Hyundai, etc.). Stations should offer multi-standard plugs or adapters (see EV Charging Cable Types and Standards).
Action Tip: For site design, mix charger levels to match user needs: multiple Level 2 ports (cost-effective) plus one or more DCFC pods at high traffic locations. Future-proof by conduit “lids” for adding power and hardware later. For example, deploy a 150 kW DCFC now with civil-work capacity for 350 kW upgrades as demand grows. (See EV Charging Station Design for layout best practices.)

Consistency in charging standards ensures seamless user experience and network efficiency. Key standards:
AC Charging (Level 1/2): SAE J1772 (Type 1) plug for North America; all EVs support this for slow/AC charging.
DC Fast Charging: CCS1 (Combo) is the default for most non-Tesla EVs in NA; CHAdeMO (legacy Nissan) is waning. Tesla’s NACS (North American Charging Standard) originated with Superchargers. In 2022–24, Tesla opened NACS to other brands; Ford, GM and others announced full NACS transitions by 2025. This means networks and OEMs are consolidating on NACS for DCFC.
Plug-and-Charge (ISO 15118): Enables automatic authentication/payment via in-vehicle credentials. Rolling out now: e.g. GM’s “NACS DC adapter” is managed through its app. “Plug-and-Charge” is expected industry-wide, simplifying user experience.
Communication Protocols: Open Charge Point Protocol (OCPP) governs charger–cloud communication. OCPP 2.0.1 supports smart charging features. Ensure your EVSE vendor supports current OCPP and ISO15118.
Timeline of Standards (North America):
| Year | Milestone |
|---|---|
| 1996 | SAE J1772 (AC Level 1/2) standardized in NA. |
| 2013 | CCS1 / CHAdeMO introduced for DCFC; Tesla Superchargers (~350V) launched NACS. |
| 2016 | Fast 150 kW DCFC widespread; utilities integrate EV planning. |
| 2022 | Tesla opens NACS spec to industry. Greenlots, ChargePoint adopt NACS-ready stations. |
| 2023 | Ford, GM, Hyundai announce EVs will have NACS (via adapters in 2024, built-in by 2025). |
| 2024 | GM opens 17,800 Tesla Superchargers to GM EVs (with $225 adapter). OCPP 2.0.1 and ISO15118 adoption rises. |
| 2025 | Widespread plug-and-charge; NACS dominant on new vehicles. NEVI corridor targets in force (150 kW stations every ~50–75 mi). |
Takeaway: Prioritize interoperability. Use multi-protocol chargers or adapters to cover CCS and NACS. Implement ISO15118 plug-and-charge and real-time network software to simplify billing and increase uptime. This reduces user friction and improves station utilization.

For operators (CPOs, site hosts, fleets), the charging business case is complex but improving:
Installation Costs: Referencing DOE/AFDC studies, typical ranges (site-dependent) are: Level 2 installs ~$1k–$15k per port; DCFC installs can be ~$50k–$250k per station (higher for remote sites or grid upgrades). Recent trends show hardware cost declines, but utility interconnection and civil works can spike budgets.
Revenue & ROI: Revenue derives from charging fees (flat, per kWh, or parking). Fleet programs often have negotiated rates. Profitability hinges on usage: high dwell-time locations (malls, workplaces) earn per kWh; highway stops monetize convenience (drivers pay premium for speed/time). Incentives (federal, state) and subsidies can offset capital spend.
Cost Recovery: Expect utility demand charges for fast charging. Smart load management (scheduled charging, on-site storage) can mitigate peaks. Partnerships (e.g. utility-run programs) may include incentives or demand-response payments (see Grid Integration below).
Example Cost Model Table: (Illustrative hardware + install ranges)
| Charger Type | Hardware Cost (USD) | Installation Cost (USD) | Notes |
|---|---|---|---|
| L2 (per port) | $400–$3,000 | $1,000–$5,000 | Range from simple (indoor) to complex (outdoor, ADA). |
| DCFC 50 kW | $30,000–$50,000 | $50,000–$150,000 | Includes panel/transformer upgrade. |
| DCFC 150 kW | $50,000–$80,000 | $100,000–$250,000 | Requires 480V 3-phase service; potential demand charges. |
| DCFC 350 kW+ | $150,000–$200,000 | $200,000+ | Utility upgrade often needed; emerging high-capex. |
(Citations: DOE EVSE cost studies; vendor data)
Operational Considerations:
Energy Costs: Fast charging heavily draws from the grid. Some operators install on-site batteries or solar to reduce demand peaks and lower electricity costs (TPBC, avoided demand charges).
Maintenance/Uptime: Charger reliability is crucial for ROI. Software for proactive diagnostics and remote support is now standard. EVSE warranties (3–5 years) and service plans should be factored.
Financing & Incentives: The U.S. BIL/IRA and Canadian programs (ZEVIP, provincial grants) cover up to 50–75% of hardware costs. Seek all available funding. For example, Canada’s ZEVIP allocated ~$266M for 353 charging projects (2019–2023). States/provinces often add incentives for equity and rural coverage.
Action Tip: Conduct a site cost-benefit analysis: Estimate load requirements, utility fees, and expected usage. Use tools like NREL’s EVI-Pro/EVI-X for financial modeling. Engage the local utility early to explore demand-management programs. Consider partnerships (e.g. co-funding from retail hosts) to share investment risk.
| Charger Type | Cost | Expected ROI |
|---|---|---|
| Level 1 | $500 – $700 | 5+ yrs |
| Level 2 | $2,000 – $5,000 | 3–5 yrs |
| DC Fast | $20,000 – $50,000 | 5+ yrs |
The surge in EV charging poses new challenges—and opportunities—for the electricity grid:
Load Growth: A fleet of EVs can add significant load. Unmanaged charging could stress distribution transformers and increase peak demand. For example, CA studies show $50+ billion of distribution upgrades by 2035 if all EV charging was flat-out on existing systems.
Grid Planning: Traditional utility planning is reactive, but EV deployment demands proactive integration. Planners must account for transportation patterns (e.g. highway vs residential charging) and accelerate interconnection processes. Joint grid-transportation planning bodies and data-sharing are emerging best practices.
Smart Charging: DR and V2G can shape the load. For instance, scheduling charging in off-peak hours reduces strain. Pilot projects (e.g. Southern Company with Ford) have demonstrated shifting fleet charging to low-demand times to save costs. AI-driven platforms (from ChargePoint, Fermata Energy, etc.) optimize charging around dynamic rates and renewable supply.
Local Storage: Co-locating batteries or solar+storage at a charging site can buffer peaks. Fleet depots increasingly install large battery systems to time-shift energy draw and provide backup power.
Interoperability & Cybersecurity: A more flexible grid uses standards like OpenADR and ISO15118 to enable chargers as grid resources. DOE’s grid integration roadmap stresses cybersecurity for EVSE and utility systems as crucial.
Grid & Policy Context: Governments encourage coordination. The U.S. Joint Office’s National Charging Plan (BIL) includes state EVSP coordination and “pay-for-performance” models. California and other states are mapping grid upgrade needs tied to EV adoption. Utilities now offer EV-specific tariffs and pilot programs (e.g. “managed charging” incentives). Canada’s CleanBC and other provincial policies also require utility involvement in infrastructure planning.
Key Insight: Integrate grid planning with charging roll-out. Work with utilities to secure service capacity ahead of installation. Leverage smart charging (see V2G & Smart Charging) to defer costly upgrades. For example, employing load management can reduce necessary transformer sizing, lowering upfront site costs.

Advanced charging management is a game-changer for both utilities and operators:
Managed Charging: Time-of-use and real-time pricing programs allow operators to charge when grid demand is low. Tools use AI to forecast load and schedule charging. For fleets, this can cut energy bills significantly.
Bi-Directional Charging (V2G/V2H): Electric vehicles can act as mobile batteries. Bidirectional Chargers enable EVs to discharge energy back to buildings or the grid. For example, a Boston pilot (Fermata Energy/CSNDC) demonstrated an apartment’s Nissan Leaf V2G unit earning ~$3,000/year by selling energy to the grid in peak demand. School bus depots and fleets are trialing V2G to provide grid services (frequency regulation, demand response) and generate revenue.
Software Platforms: Modern EVSE management platforms incorporate AI for uptime optimization, predictive maintenance, and dynamic energy allocation. ChargePoint, Tesla, and others emphasize “software-defined charging” where cloud intelligence aligns charging to system needs.
Standards: ISO15118 V2G profiles (V2G and V2H) are being standardized. NREL and DOE are researching V2G’s technical and business viability; work is ongoing to integrate EVs into grid markets.
Takeaway: Leverage smart charging to maximize value. Use AI-driven schedulers to shift charging loads and participate in utility DR programs. Explore V2G especially for fleets and stationary backup power. Even if bi-directional revenue is modest today, technology adoption will grow (and may become a competitive differentiator).

Government programs are catalyzing infrastructure build-out:
NEVI (USA): The National Electric Vehicle Infrastructure formula (part of the 2021 IIJA) initially allocated ~$5B to deploy ~500,000 high-speed chargers along designated corridors. As of 2024, however, NEVI faced delays: new guidance paused new obligations (Feb 2025), with only ~$500M disbursed by late 2024. State DOTs are re-submitting plans. For B2B actors, this means pushback on some corridor projects, but the intent remains to fund strategic fast chargers nationwide.
ZEVIP (Canada): NRCan’s Zero-Emission Vehicle Infrastructure Program has funded hundreds of projects (e.g. $265.9M for 353 projects through 2023). Budget 2024 committed >$1B more (ZEVIP + Canadian Infrastructure Bank) to install ~84,500 chargers by 2029. This continuous funding pipeline supports public L2/DCFC and hydrogen refueling (though focus is EV).
State/Provincial Programs: Many U.S. states launched their own EV incentives (e.g. California’s EVIP, rebates, or per-kW programs) and Canada’s provinces are highly active (Ontario, BC, Quebec each have charging funds). Business owners should monitor local opportunities.
Public–Private Models: Some jurisdictions (e.g. New York, BC) are using P3 models to build stations with private operators delivering service under public financing. Others leverage utility regulation to require load-building.
Action Tip: Pursue multi-stakeholder financing. Bundle together federal NEVI/ZEVIP funds, state incentives, and private capital to improve project IRR. For example, leverage NEVI subsidies for highway stations and provincial grants for regional sites. NGOs (e.g. Electrify Canada) and CIB in Canada actively co-invest in mega-projects. Always align projects with program requirements (e.g. NEVI’s non-proprietary standards, ADA compliance).
Smart Corridor Chargers (U.S. Highways): Electrify America (VW settlement) rapidly deployed 800+ DCFC sites by 2024 across 40 states, focusing on 150–350 kW chargers at travel centers. Though early utilization was modest, they’ve refined partner models (e.g. 30-year concessionaire deals) and tech (integrated solar/storage). Their experience shows hub-and-spoke planning: central fast-charging hubs feeding nearby slower chargers.
Urban Fleet Electrification: Southern Company’s managed charging pilot with Ford Pro (2024) successfully shifted medium-duty truck charging to off-peak hours, demonstrating >20% energy cost savings. Lessons: fleet telematics + DSO integration can optimize scheduling without impacting operations.
Affordable Housing V2G (Boston): The BlueHub/CSNDC pilot (Sept 2023) is notable for social impact. Installing a Nissan LEAF with Fermata’s V2G charger, the building uses the car’s battery during summer peaks, earning revenue. Outcome: “charging deserts” for low-income communities can be addressed via innovative tech+financing. Key lesson: pair V2G with supportive rental models (EV as rentable asset) to overcome affordability and equity gaps.
Regional Networks (Canada): Quebec’s aggressive plan (116,700 stations by 2030) is already boosting EV sales. Private players (Flo, Petro-Canada EVGo) are building province-wide L3 networks. Their success highlights coordination: provinces that set clear targets and PPP frameworks (e.g. Flo’s 500 ultra-fast ports in QC/ONinstitute.smartprosperity.ca) attract more infrastructure investment.
International Example (Germany): Not in NA but instructive: Germany’s Autobahn-E programs mandated fast chargers every 100 km. NACS adoption in Europe (e.g. VW Electrify Europe adding NACS connectors) signals global convergence. NA can learn from EU’s mix of regulation (AFIR) and subsidies.
Implementation Tips:
Scalable Design: Start with modular installations that allow easy expansion. E.g., deploy a “charger farm” with empty conduits and oversize transformer.
Location Synergy: Co-locate chargers with amenities (restrooms, restaurants) to increase dwell time and convenience.
Monitoring & Data: Instrument new sites with granular metering. Use data to refine billing and plan upgrades.
Community Engagement: Engage local stakeholders (municipalities, transit agencies) early to ensure permitting and equity considerations.
Looking beyond 2025, several trends will shape charging technology:
Ultra-fast & 800V: Chargers >500 kW will become common for high-end BEVs and fleets. Advanced cooling (liquid-cooled cables) will be needed. Battery chemistries (e.g. solid-state) may allow even higher power acceptance.
Wireless Charging: Still emerging, inductive charging pads (for taxis, buses, even passenger cars at homes/offices) may see pilots by 2030, especially for use cases demanding convenience (fleet yards, automated parking).
Integration with Renewables: More charging stations will have solar canopies or co-located wind to self-supply. Bidirectional V2H will allow EVs to serve as backup during outages or to stabilize home grids (especially in areas with high blackout risk).
Autonomous EV Charging: In fleet contexts, automated vehicles will handle their own charging (robotic connectors or automated parking). Infrastructure must accommodate off-peak and remote management.
Market Evolution: Expect further consolidation: Tesla’s NACS standard is likely to dominate, while CCS may wane. Interoperability efforts (e-roaming, unified payment platforms) will simplify cross-network usage.
Regulatory Changes: Building codes increasingly require EV readiness (pre-wiring). Utility rate reforms (demand charges adjustment, vehicle charging tariffs) will evolve to balance grid impacts. Stakeholders should monitor these closely.
Concrete Takeaway: Plan for adaptability. Invest in chargers that can be upgraded (e.g. L2 units later turned into smart chargers). Choose locations that won’t be bypassed by future technology. Build partnerships with utility/tech vendors to pilot new solutions (e.g. AI management, V2X). Maintain flexibility in business models as markets mature.
The On-Board Charger (OBC) is a critical component installed inside the electric vehicle. Its primary function is to convert the Alternating Current (AC) drawn from the grid into Direct Current (DC), which is the only type of power the car’s battery can store. For both Level 1 and Level 2 charging, the electricity must pass through the OBC. Its power rating dictates the maximum AC charging speed the vehicle can accept.
The cost of a DC Fast Charging (DCFC) station is significantly higher. The main reason is that while the AC-to-DC conversion for Level 2 charging occurs inside the vehicle, DCFC requires the charging station itself to house a massive, high-power AC-to-DC converter. This external unit involves much more complex power electronics, heavy-duty transformers, and advanced cooling systems, resulting in far greater initial equipment and installation costs compared to a Level 2 unit.
Smart charging systems help users save money through Time-of-Use (TOU) optimization. By connecting to grid data, the system automatically identifies and schedules the charging session to occur primarily during off-peak hours (often late at night) when utility rates are lowest. The user simply plugs in the car, and the system intelligently manages the charging time to minimize the operational cost of electricity.
V2G (Vehicle-to-Grid) is advanced bi-directional charging technology that allows an EV to not only draw power from the grid but also send stored energy back to the grid when needed. It relies on smart charging systems to manage and control this two-way power flow safely, efficiently, and according to grid demands. V2G is a critical future trend for grid stabilization and the integration of sustainable energy sources.
Due to technological advancements, the energy transfer efficiency of modern wireless EV charging is now very close to that of traditional wired charging. While high-quality wired charging typically achieves 90% to 95% efficiency, leading wireless systems have boosted their performance to similar levels (often 90% to 93%) under optimal conditions. The slight energy loss is often considered an acceptable trade-off for the significant gains in convenience and user experience.
As EV adoption accelerates across North America, mastering the evolving landscape of EV Charging Technology is no longer optional—it’s strategic. Whether you’re a site planner, fleet operator, or equipment manufacturer, the opportunities are clear:
✅ Stay ahead with high-speed, standards-compliant hardware.
✅ Future-proof your infrastructure through smart grid integration and modular site design.
✅ Tap into public-private funding (like NEVI or ZEVIP) to scale with lower risk.
💡Now is the time to move from learning to deploying.
If you’re ready to bring smarter charging to your next location, consult our EV Charging Infrastructure Planning Hub or get a personalized roadmap from our deployment experts.
Authoritative Citation Sources
Natural Resources Canada – ZEV Infrastructure Program (ZEVIP)
We will send detailed technical info and quotation to you!